Advanced Programming and Data Analysis in R (PUBH 7462) has been called the “most fun” and “most useful” class by students who have taken it. The School of Public Health (SPH) course is designed to prepare students for real-world applications of visualizing complex data using the programming language “R,” widely used by statisticians and others for data analysis and communications. The opportunity for students to leverage their course learning across a vast array of fields is both extremely powerful, and engrossing to participants.
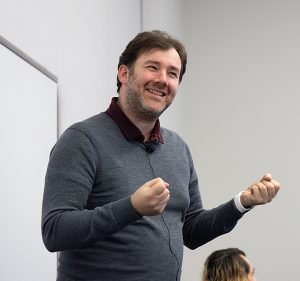
“Students always say that the biggest problem with the class is that they end up spending way more time than they wanted to—not because I was forcing them to, but because they got so into it that they would say, ‘I can’t stop working on this because it’s so fun,’” says course instructor and Associate Professor Julian Wolfson, who notes the class has been met with an overwhelmingly positive response from students.
Advancing Careers through Data Visualization
“This course definitely gave me the intensive skills that I needed to be able to visualize data and present it in different ways,” says Santiago Charry, a student in the Public Health Data Science MPH program, one of the few MPH programs in the country that focus on analyzing data and statistics to advance public health. Charry works a nearly full-time job at Bright Research Partners, an organization based in Minneapolis that helps MedTech companies manage, design, and analyze clinical trial data.
After five years working in data management, Charry found himself more interested in working with the organization’s statistics team. “Now they’re shifting me more towards the statistical team, so I’m excited to be able to go out, develop reports, and to look at safety and efficacy data for clinical trials.”
Kate Faber, a PhD student studying environmental engineering in the College of Science & Engineering, says that she had already taught herself some R programming through her work in research labs during her undergraduate and graduate studies. “I thought the course would be a great way to build on and expand what I already knew how to do,” says Faber. “It turned out to be exactly that.”
Faber is researching a group of molecules called polyfluoroalkyl substances (PFAS), also known as forever chemicals. “One of the challenges of understanding and regulating PFAS is that it’s a diverse group of thousands and thousands of different molecules,” says Faber. “For my class project, I combined all those into one big data set, and then built an interface that lets a user explore some of the trends in that data.”
Faber says that anyone considering a career that includes clearly communicating with data could benefit from the course. “I already recommend this course to students coming up behind me. I think that having basic skills in R is really valuable in almost any field, not even just STEM fields… Everyone can benefit.”
Harnessing the Power of Data
“The course is a really cool survey of the tools available for data science and the power of those tools to take this raw data that’s just massive—you know, 100 columns, a million rows—and synthesize it into something that a layperson can actually interpret. It’s probably the most useful class I’ve ever taken,” says Gretchen North, a fourth-year honors student in Fisheries, Wildlife and Conservation Biology in the College of Food, Agriculture & Natural Resources, who took the course because of her interest in applied field ecology research.
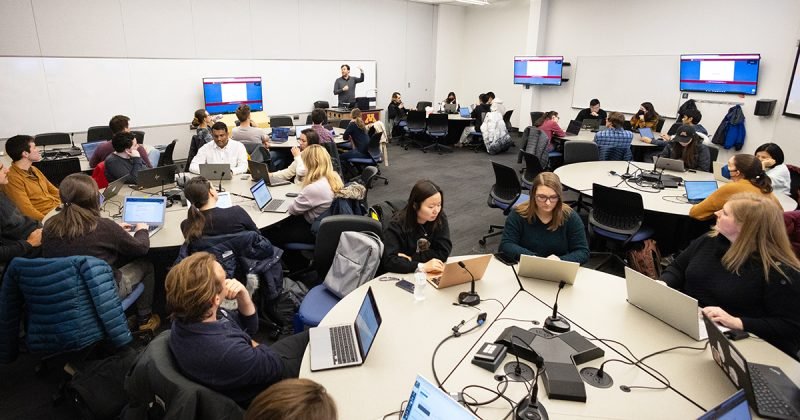
Just like North, students from colleges throughout the University, in fields from ecology to kinesiology, and biostatistics to civil engineering have enrolled to leverage data in their respective fields.
“[That’s] because the content is really focused around the programming,” says Wolfson. “You don’t have to have a health background.”
As their final project in the course, students create an interactive data visualization application around a topic of their choice. For her project, North did exactly that, creating an interactive website where a visitor could explore many facets of soil biodiversity in Kenya. As an undergraduate student, North spent two field seasons in Kenya studying soil invertebrates and biodiversity. “I’ve got all my data, and I was really interested in ‘How do you present these findings? How do you create them in a way that can be interactive?’”
Making data accessible through visualizations is becoming a standard request for researchers, and that’s a big factor driving interest in the course. “In order to stand out among all the different outlets that are presenting information, you have to make your data visualizations compelling and clear,” says Wolfson.
“That’s what makes this course a little distinct,” he adds. “It’s focused on building tools for communicating with data. Because in public health, communication is a huge part of the game.”